Compared to plot_trajectory() this function:
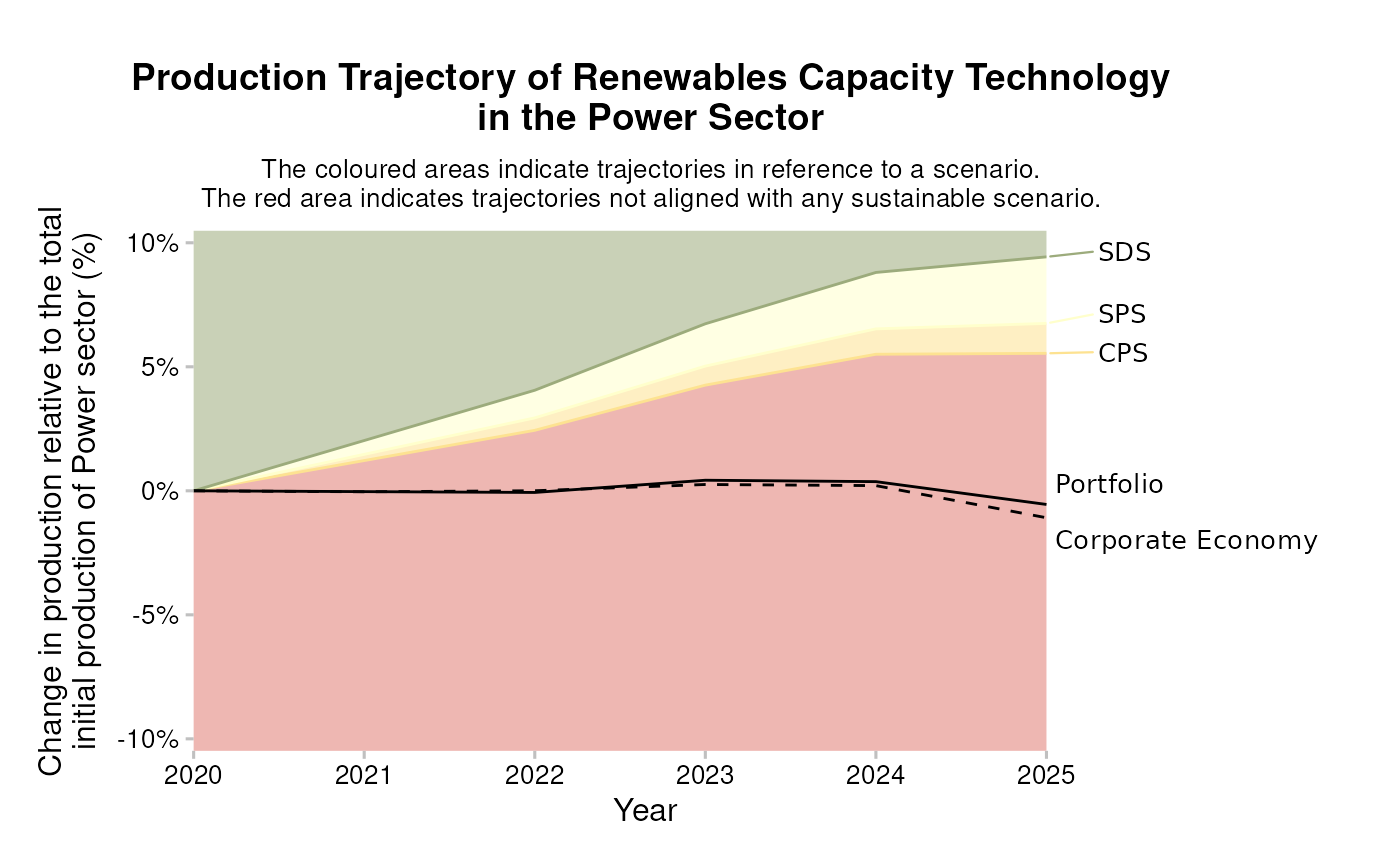
is restricted to plotting only 5 years from the start year,
outputs pretty legend labels, based on the column holding metrics,
outputs a title,
outputs a subtitle,
outputs informative axis labels in sentence case.
Arguments
- data
A data frame like the outputs of
prep_trajectory().(Optional) If present, the column
labelis used for data labels.
See also
Other plotting functions:
plot_emission_intensity(),
plot_techmix(),
plot_trajectory(),
prep_emission_intensity(),
prep_techmix(),
prep_trajectory(),
qplot_emission_intensity(),
qplot_techmix(),
recode_metric_techmix(),
recode_metric_trajectory(),
scale_colour_r2dii(),
scale_colour_r2dii_sector(),
scale_colour_r2dii_tech(),
scale_fill_r2dii(),
scale_fill_r2dii_sector(),
scale_fill_r2dii_tech(),
spell_out_technology(),
theme_2dii(),
to_title()
Examples
# `data` must meet documented "Requirements"
data <- subset(
  market_share_demo,
  sector == "power" &
    technology == "renewablescap" &
    region == "global" &
    scenario_source == "demo_2020"
)

qplot_trajectory(data)