Skip to contents

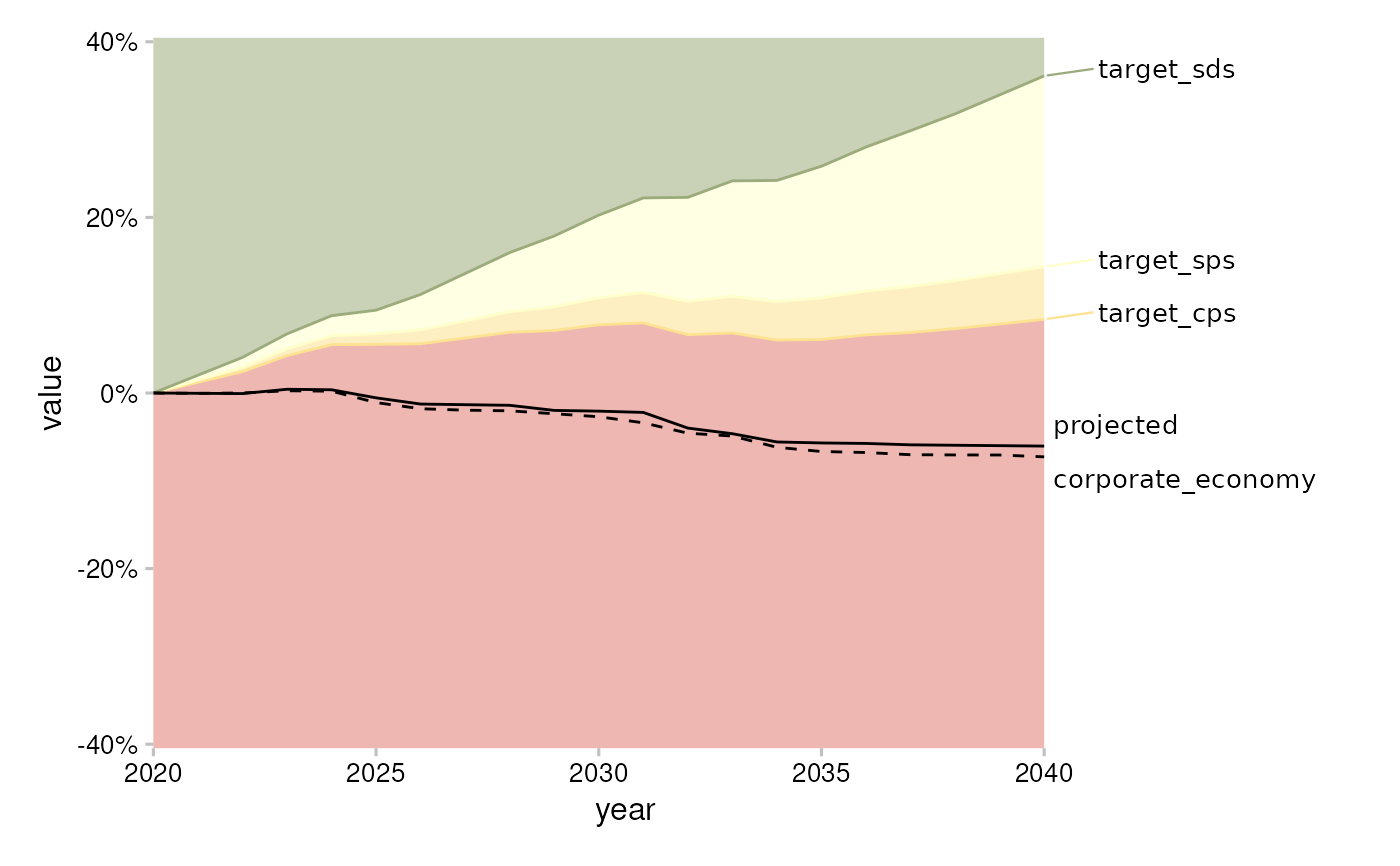
Create a trajectory plot

Usage

plot_trajectory(
  data,
  span_5yr = FALSE,
  convert_label = identity,
  center_y = FALSE,
  value_col = "percentage_of_initial_production_by_scope",
  perc_y_scale = FALSE
)

Arguments

data

A data frame. Requirements:

  • The structure must be like market_share.

  • The following columns must have a single value: sector, technology, region, scenario_source.

  • (Optional) If present, the column label is used for data labels.

span_5yr

Logical. Use TRUE to restrict the time span to 5 years from the start year (the default behavior of qplot_trajectory()), or use FALSE to impose no restriction.

convert_label

A symbol. The unquoted name of a function to apply to y-axis labels. For example:

  • To convert labels to uppercase use convert_label = toupper.

  • To get the default behavior of qplot_trajectory() use convert_label = recode_metric_trajectory.

center_y

Logical. Use TRUE to center the y-axis around start value (the default behavior of qplot_trajectory()), or use FALSE to not center.

value_col

Character. Name of the column to be used as a value to be plotted.

perc_y_scale

Logical. FALSE defaults to using no label conversion. Use TRUE to convert labels on y-axis to percentage using scales::percent (the default behavior of qplot_trajectory()).

Value

An object of class "ggplot".

See also

Examples

# `data` must meet documented "Requirements"
data <- subset(
  market_share,
  sector == "power" &
    technology == "renewablescap" &
    region == "global" &
    scenario_source == "demo_2020"
)

plot_trajectory(data)
#> Warning: The `data` argument of `plot_trajectory()` must be prepped already as of
#> r2dii.plot 0.4.0.
#>  From the next release you will need to call
#>   `r2dii.plot::plot_trajectory(data)` prior to calling
#>   `r2dii.plot::plot_trajectory()`.
#>  Alternatively custom data preparation will also become possible.


# plot with `qplot_trajectory()` parameters
plot_trajectory(
  data,
  span_5yr = TRUE,
  convert_label = recode_metric_trajectory,
  center_y = TRUE,
  value_col = "percentage_of_initial_production_by_scope",
  perc_y_scale = TRUE
)