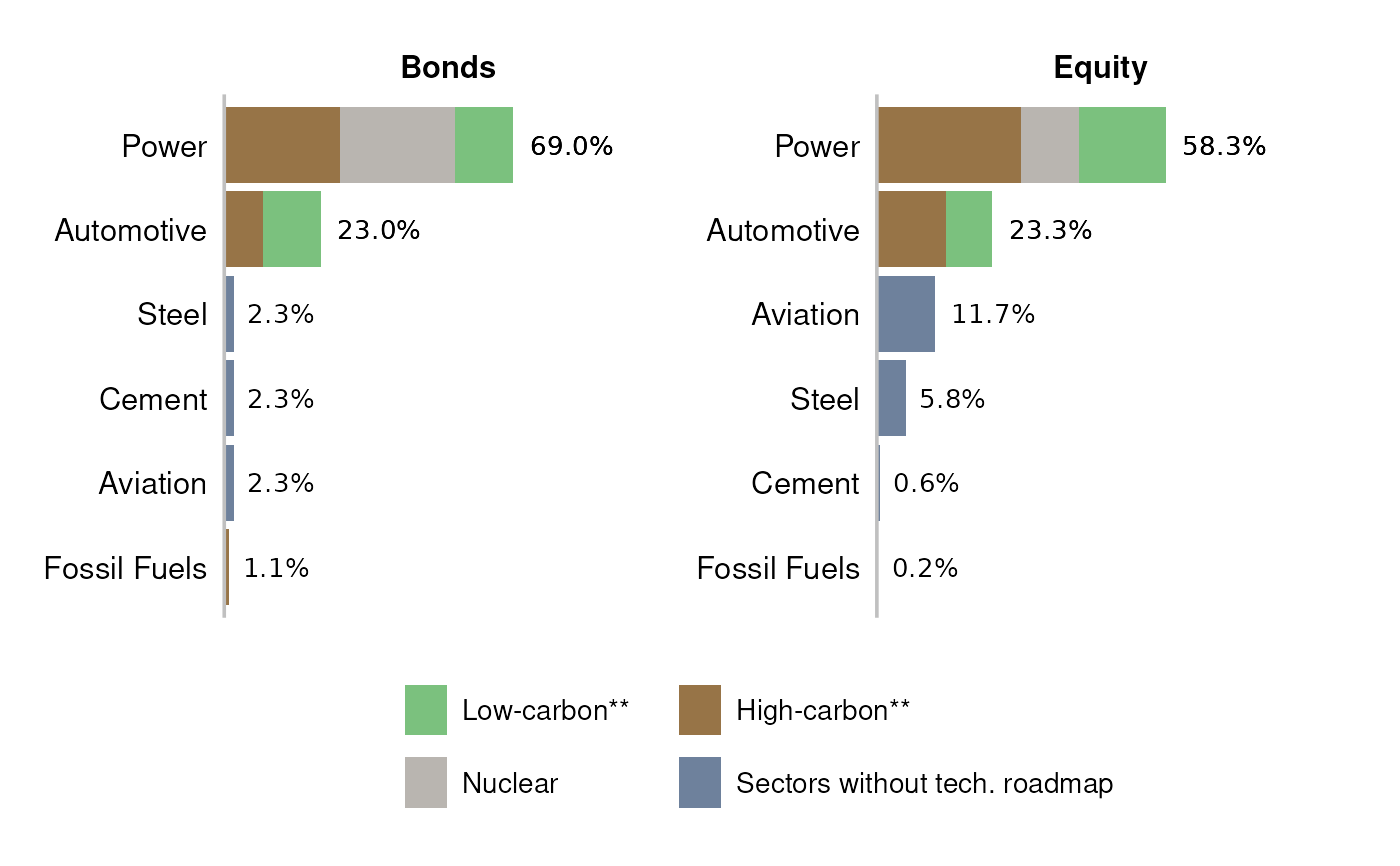
Create a bar plot with exposures to low and high carbon technologies
Source:R/plot_green_brown_bars.R
plot_green_brown_bars.RdCreate a bar plot with exposures to low and high carbon technologies
Arguments
- data
A data frame. In principle, an output of
prep_green_brown_bars(). Requirements:Must have columns:
asset_class,tech_type,sector,perc_sec_exposure,perc_tech_exposure.tech_typecolumn must only have following values: "green", "nuclear", "brown", "other".perc_tech_exposureandperc_sec_exposuremust be percentages in decimal format, with values between 0 and 1.