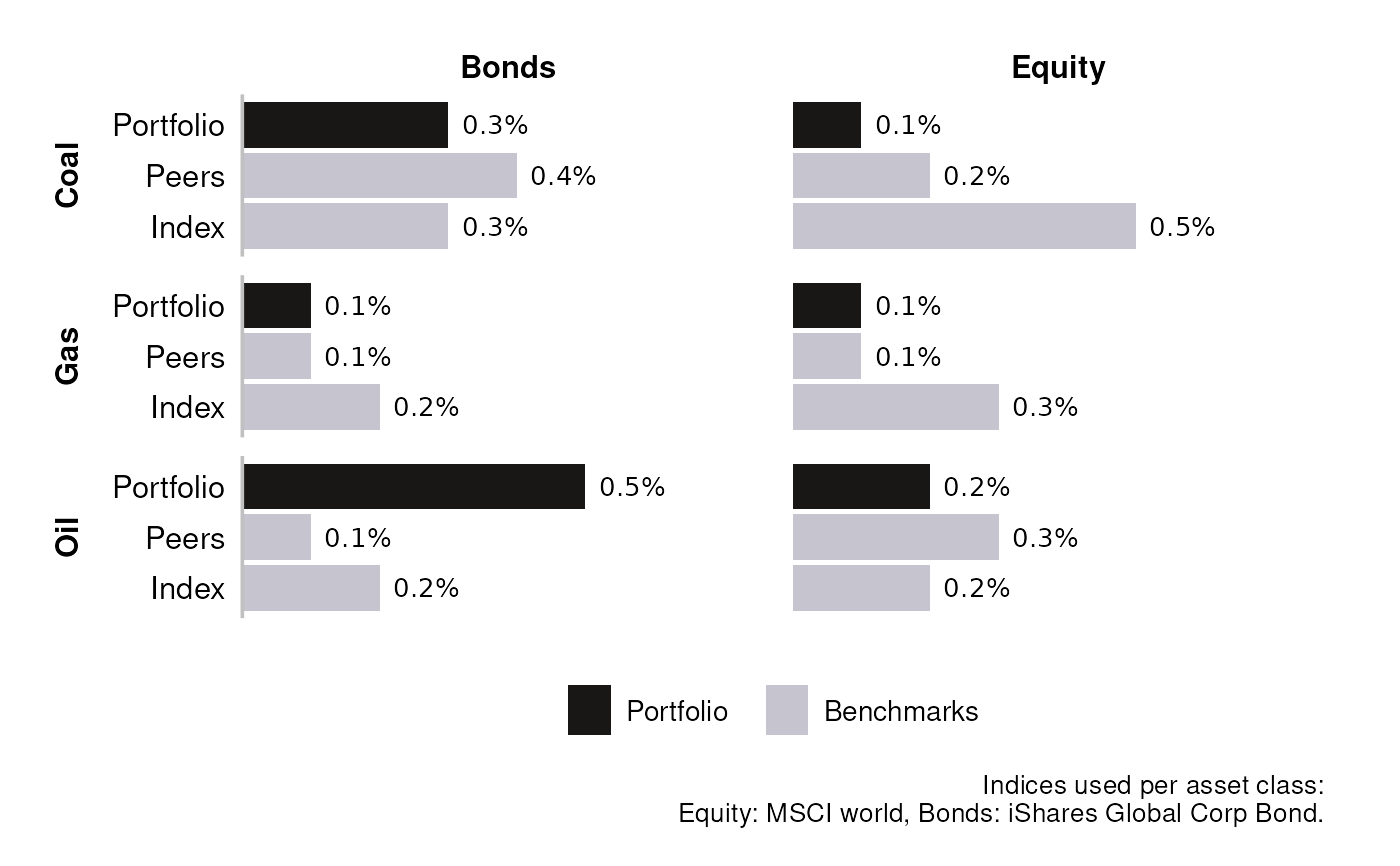
Create a bar plot with exposures to fossil fuels
Arguments
- data
A data frame. In principle, an output of
prep_fossil_bars(). Requirements:Must have columns:
entity_name,entity_type,asset_class,tech,perc_aum.techcolumn must only have following values: "coal", "oil", "gas"perc_aummust be a percentage in decimal format, with values between 0 and 1.